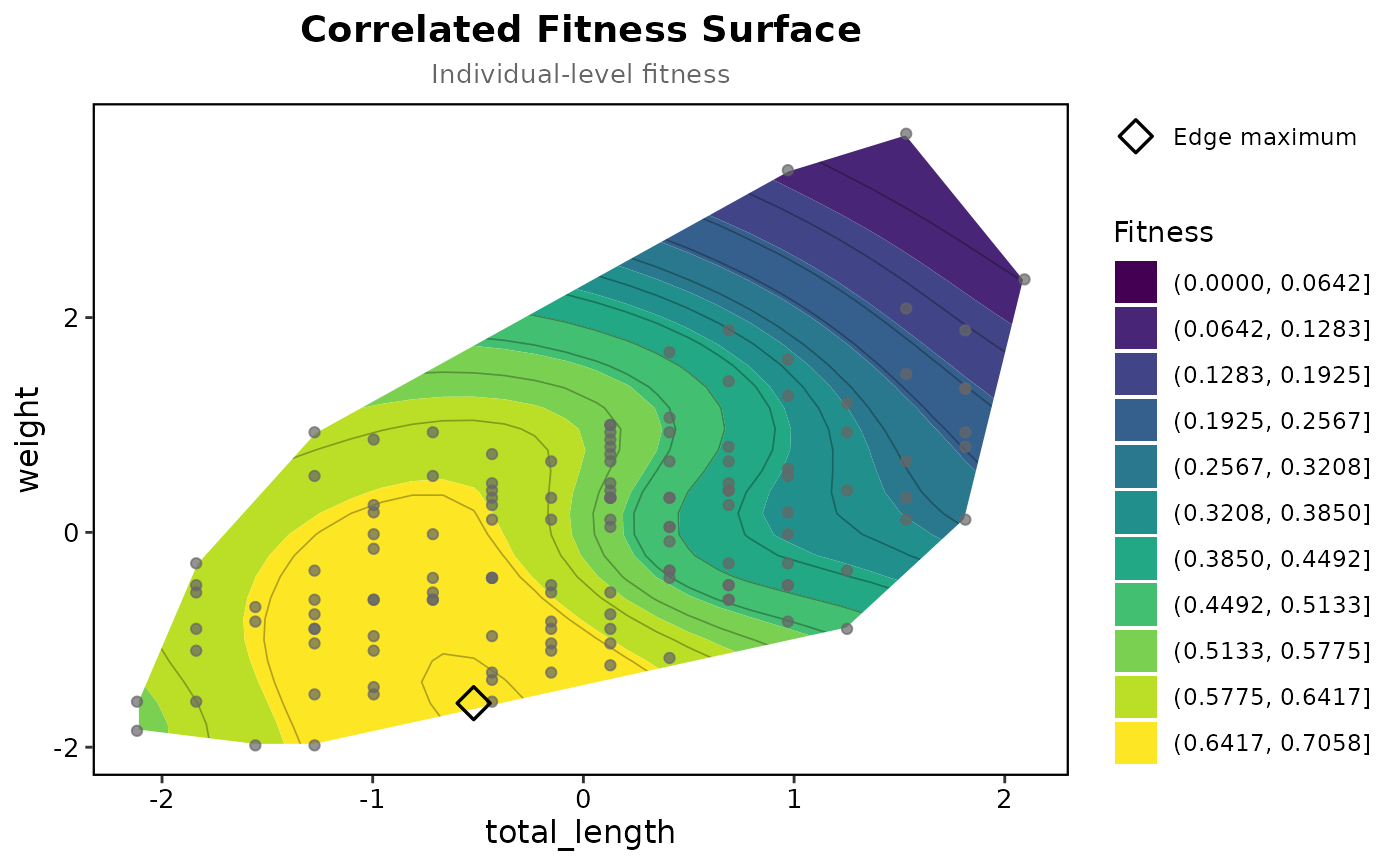
Plot Correlated Fitness Surface
Usage
plot_correlated_fitness(
  tps,
  trait_cols,
  bins = 12,
  point_alpha = 0.7,
  show_points = FALSE,
  show_optimum = TRUE,
  show_groups = TRUE,
  group_lines = TRUE,
  uncertainty = c("none", "se", "band"),
  ...
)
Arguments
- tps
Output list from
correlated_fitness_surface().- trait_cols
Character vector of length 2 specifying the trait column names.
- bins
Integer specifying the number of contour bins. Default is 12.
- point_alpha
Numeric value for point transparency. Default is 0.7.
- show_points
Logical indicating whether to show original data points. Default is
FALSE.- show_optimum
Logical; mark the highest kept cell, a gold diamond, or an open one when it is on the edge of the data. Default is
TRUE.- show_groups
Logical; when the surface was fitted with a
group, draw each group's mean (open circle, labelled) and the highest point of the surface within that group's hull: a filled triangle when it is a peak of the surface, an open one when the surface keeps rising past the group's range or the edge of the data. Default isTRUE.- group_lines
Logical; join each group's mean to its peak with a dashed line. Default is
TRUE.- uncertainty
What to draw of the surface's standard error, which a GAM surface carries:
"none"(the default),"se"for dashed contour lines of the standard error of the fitted fitness over the surface, or"band"for three panels, the lower bound, the fit and the upper bound, on one fill scale.- ...
Additional arguments passed to
ggplot2::labs().
Examples
prep <- prepare_selection_data(bumpus, "survival", c("total_length", "weight"))
surf <- correlated_fitness_surface(prep, "survival", c("total_length", "weight"), grid_n = 30)
#> Data type: binary; method: gam; n = 136; k = 29
#> GAM fitting with 136 observations
#>   Trying formula: main
#> Success with formula: main
#> Predictions range: 0.0472 to 0.703
#> Masked 424 of 900 grid points outside the data
plot_correlated_fitness(surf, c("total_length", "weight"), show_points = TRUE)