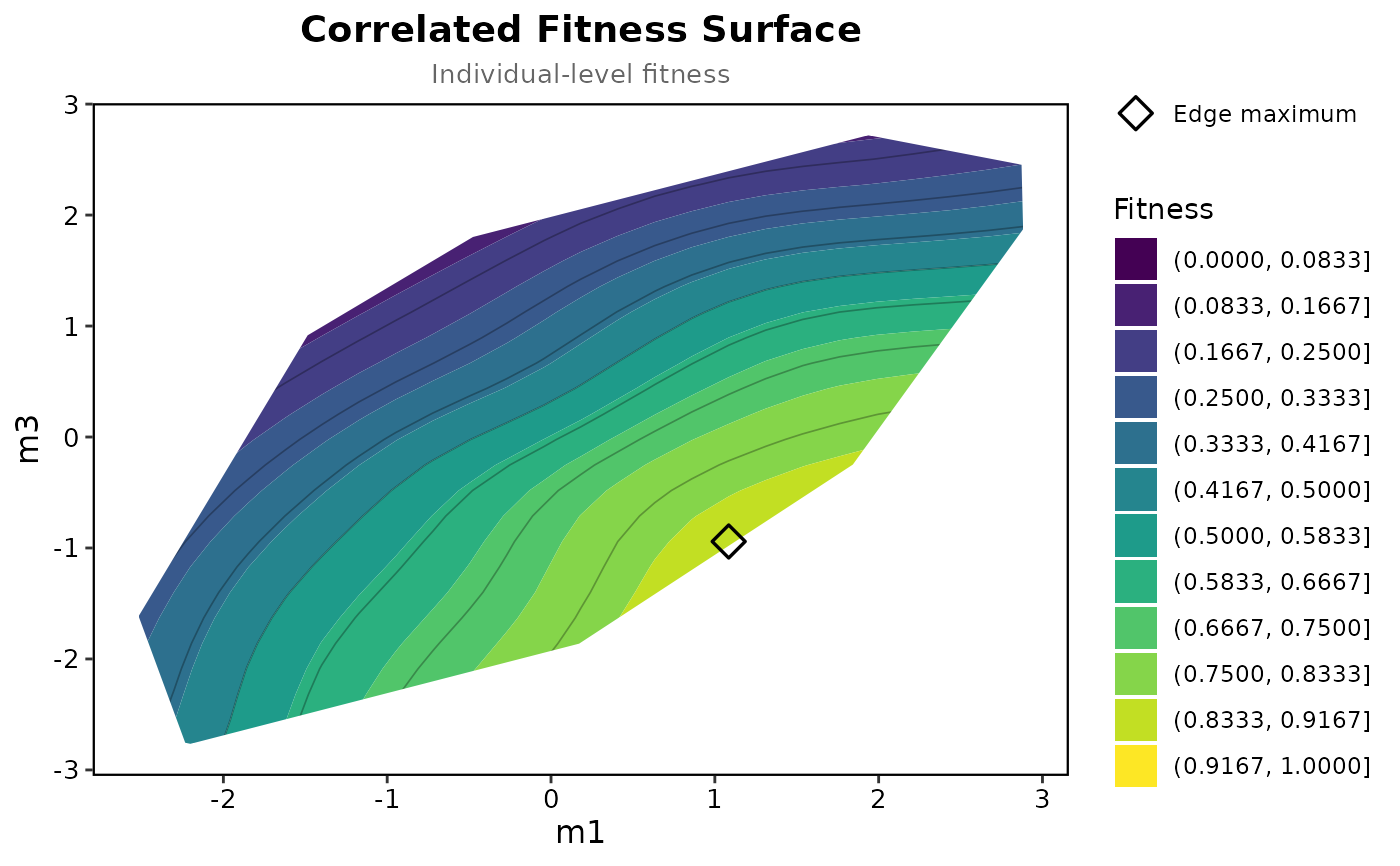
Draws the fitness surface in the space of two canonical axes, or the
fitness function along one, from the scores of canonical_analysis().
A negative \(\lambda\) is stabilising selection along an axis only when
fitness along that axis has a peak inside the data, otherwise it is
only curvature.
Arguments
- ca
Output of
canonical_analysis().- which
One or two axis numbers. Default is
1:2.- grid_n
Grid resolution of the surface. Default is 40.
- ...
Passed to
plot_correlated_fitness()for two axes or toplot_univariate_fitness()for one.
Examples
ca <- canonical_analysis(bumpus, "survival", c("total_length", "weight", "humerus"))
#> Warning: Collinear traits (VIF above 5) may inflate the standard errors
plot_canonical_axes(ca, which = c(1, 3), grid_n = 25)